Chart Editor
Rose allows you to customize your charts, enabling you to visualize and label your data for improved shareability.
Note: if you add/change any of the rosecodes in the code module <>, the chart customization will reset.
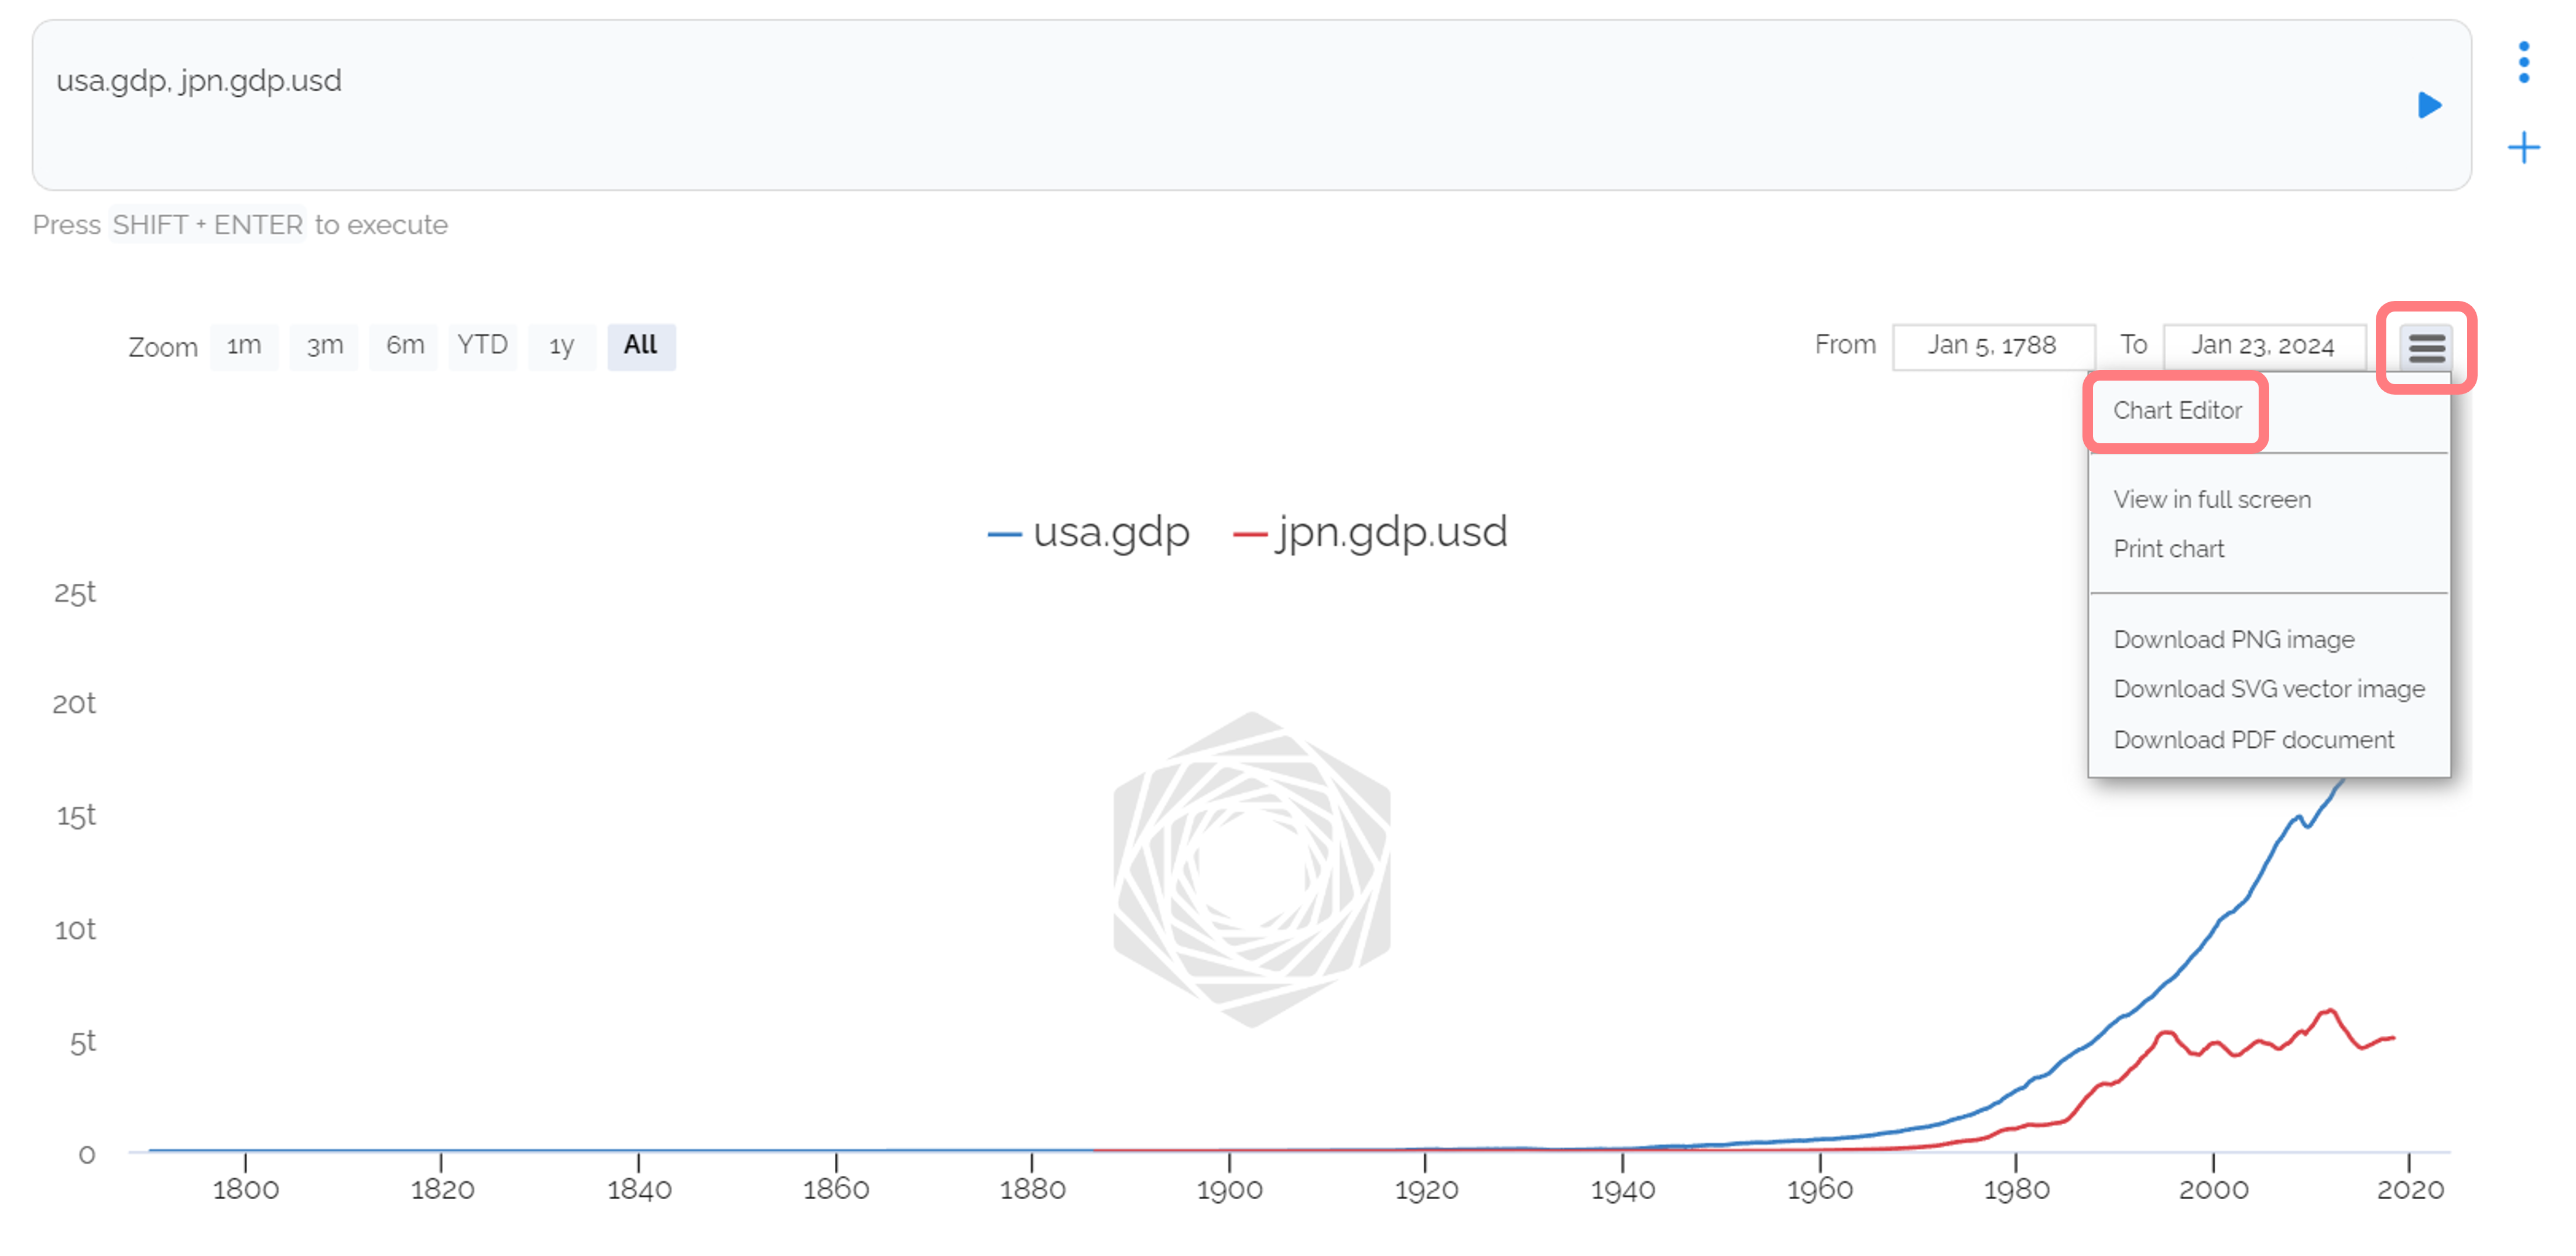
Accessing the Chart Editor
To access the chart editor, simply click on the hamburger menu in the top right coner of the chart area. This will open a pane from the right hand side of the screen with the chart editing options for that specific chart. Don't forget to press save to lock in your changes!
Example Edited Chart
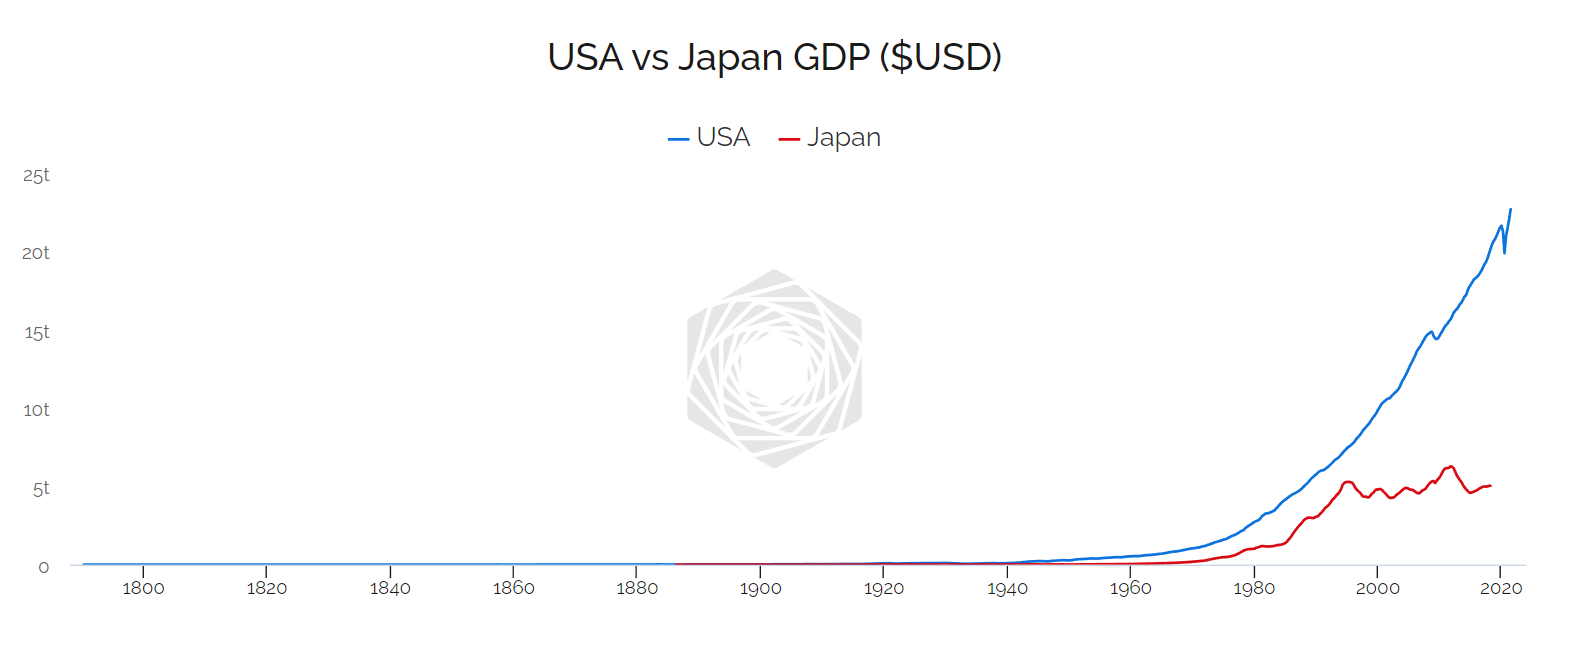
Chart Editor Pane
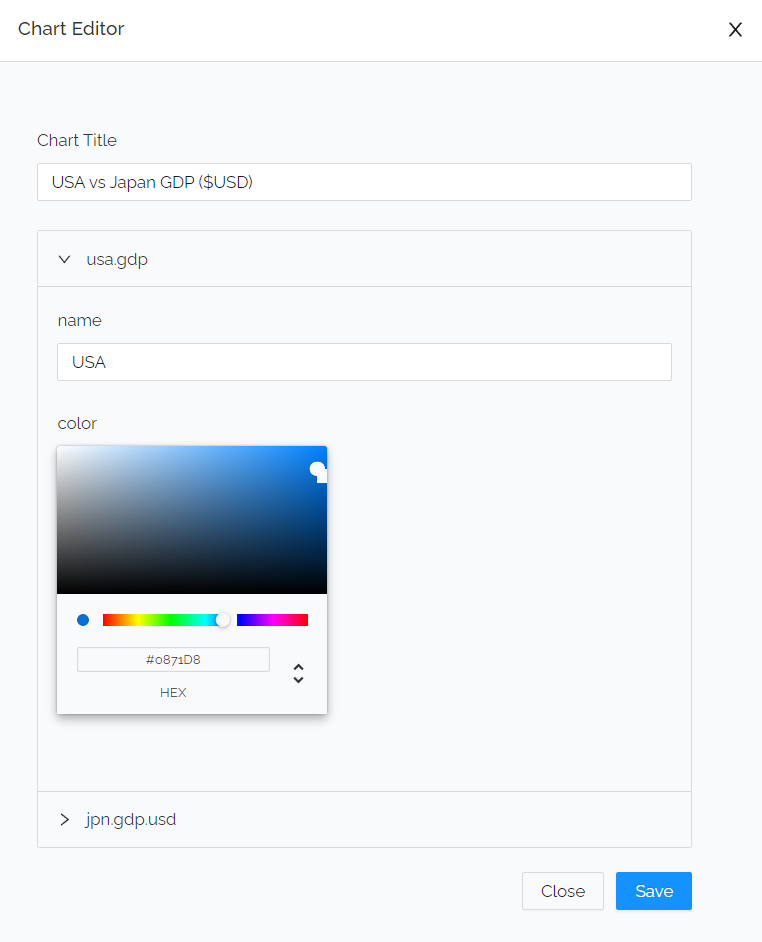
Chart Title
Add a descriptive title to your entire chart.
Series Options
For each series in your chart, you can customize the settings.
Display Name
Set a display name for each series; this will be how the series is shown in the legend.
Color
Set a specific color for each series, using the color picker or entering the desired color code (HEX, RGB, HSL).